Prediction : Rain in Australia
프로젝트 데이터 : Rain in Australia
호주의 여러 지역에서 측정된 온도, 풍향, 습도 등 주어진 데이터를 통해 다음날 비가 왔는지를 예측해 볼 수 있다.
Target : RainTomorrow (Yes or No)
데이터를 선정한 이유
기상청에서도 잘 예측하지 못하여 우리가 늘 불평하는 날씨 예보. 우리 스스로는 얼마나 정확하게 이를 예측할 수 있는지 머신러닝으로 확인해 보고 싶었다.
- 문제의 유형 -> yes or no 를 판별하는 것이므로 Classification 문제로 접근한다.
import numpy as np
import pandas as pd
import matplotlib.pyplot as plt

from sklearn.model_selection import train_test_split, cross_val_score
from category_encoders import OneHotEncoder, TargetEncoder, OrdinalEncoder
from sklearn.feature_selection import f_regression, SelectKBest
from sklearn.impute import SimpleImputer
from sklearn.linear_model import Ridge, LogisticRegression, LinearRegression
from sklearn.pipeline import make_pipeline, Pipeline
from sklearn.preprocessing import StandardScaler
from sklearn.metrics import accuracy_score, f1_score, classification_report


from xgboost import XGBClassifier
from sklearn.tree import DecisionTreeClassifier
from sklearn.ensemble import RandomForestClassifier, RandomForestRegressor
from sklearn.model_selection import RandomizedSearchCV
from lightgbm import LGBMClassifier

import missingno as msno
import seaborn as sns

import imblearn
from imblearn.over_sampling import RandomOverSampler

from scipy.stats import randint, uniform
pd.read_csv('/Users/wooseokpark/Documents/codestates/rain-in-aus/weatherAUS.csv').head()
| Date | Location | MinTemp | MaxTemp | Rainfall | Evaporation | Sunshine | WindGustDir | WindGustSpeed | WindDir9am | ... | Humidity9am | Humidity3pm | Pressure9am | Pressure3pm | Cloud9am | Cloud3pm | Temp9am | Temp3pm | RainToday | RainTomorrow | |
|---|---|---|---|---|---|---|---|---|---|---|---|---|---|---|---|---|---|---|---|---|---|
| 0 | 2008-12-01 | Albury | 13.4 | 22.9 | 0.6 | NaN | NaN | W | 44.0 | W | ... | 71.0 | 22.0 | 1007.7 | 1007.1 | 8.0 | NaN | 16.9 | 21.8 | No | No |
| 1 | 2008-12-02 | Albury | 7.4 | 25.1 | 0.0 | NaN | NaN | WNW | 44.0 | NNW | ... | 44.0 | 25.0 | 1010.6 | 1007.8 | NaN | NaN | 17.2 | 24.3 | No | No |
| 2 | 2008-12-03 | Albury | 12.9 | 25.7 | 0.0 | NaN | NaN | WSW | 46.0 | W | ... | 38.0 | 30.0 | 1007.6 | 1008.7 | NaN | 2.0 | 21.0 | 23.2 | No | No |
| 3 | 2008-12-04 | Albury | 9.2 | 28.0 | 0.0 | NaN | NaN | NE | 24.0 | SE | ... | 45.0 | 16.0 | 1017.6 | 1012.8 | NaN | NaN | 18.1 | 26.5 | No | No |
| 4 | 2008-12-05 | Albury | 17.5 | 32.3 | 1.0 | NaN | NaN | W | 41.0 | ENE | ... | 82.0 | 33.0 | 1010.8 | 1006.0 | 7.0 | 8.0 | 17.8 | 29.7 | No | No |
5 rows × 23 columns
Baseline model 설정 : 항상 비가 오지 않는 것으로 예측
aus_base = pd.read_csv('/Users/wooseokpark/Documents/codestates/rain-in-aus/weatherAUS.csv')

# yes -> 1, no -> 0 으로 바꾸어줌
def yesno(x):
    if x == 'Yes':
        return 1
    elif x == 'No':
        return 0

aus_base['RainToday'] = aus_base['RainToday'].apply(yesno)
aus_base['RainTomorrow'] = aus_base['RainTomorrow'].apply(yesno)

# 결측치 제거
aus_base = aus_base.dropna(subset=['RainToday', 'RainTomorrow'])

# baseline model - 항상 비가 오지 않을 것으로 예측
y_pred_base = pd.DataFrame({'RainTomorrow':np.zeros(len(aus_base['RainToday']))})
y_test = aus_base[['RainTomorrow']]

accuracy = classification_report(y_test[:-1], y_pred_base[:-1])
print(accuracy)
precision recall f1-score support
0.0 0.78 1.00 0.88 109585
1.0 0.00 0.00 0.00 31201
accuracy 0.78 140786
macro avg 0.39 0.50 0.44 140786
weighted avg 0.61 0.78 0.68 140786
/Users/wooseokpark/miniforge3/envs/kaggle/lib/python3.8/site-packages/sklearn/metrics/_classification.py:1308: UndefinedMetricWarning: Precision and F-score are ill-defined and being set to 0.0 in labels with no predicted samples. Use `zero_division` parameter to control this behavior.
_warn_prf(average, modifier, msg_start, len(result))
baseline model 결과:
이미 accuracy가 78%에 달한다. 상당한 imbalance가 타겟에 존재하기 때문.
averaged f1 score : 0.44
EDA 및 데이터 전처리
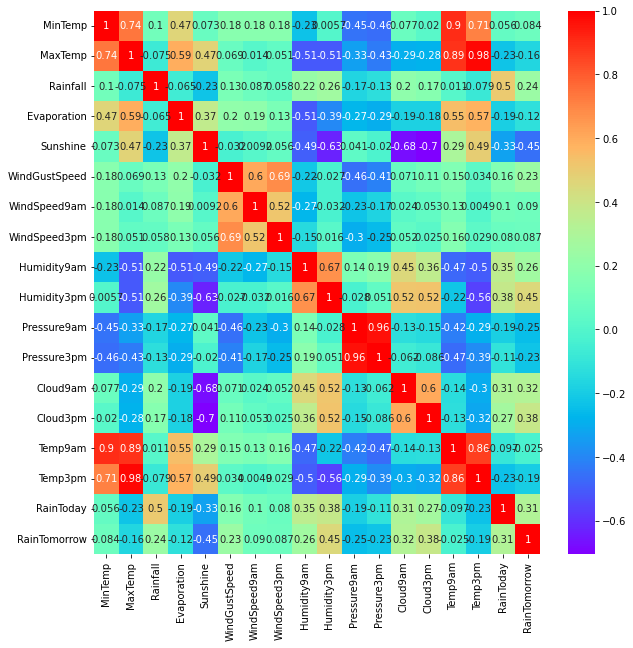
# feature 간의 correlation 파악하기
# 높은 correlation 보이는 feature들은 통일하거나 없앤다.

plt.figure(figsize=(10,10))
sns.heatmap(aus_base.corr(),
           annot=True,
           cmap='rainbow')
<AxesSubplot:>
aus_base_high = aus_base.corr().copy()
aus_base_high[~(aus_base_high > 0.7) ] = 0

plt.figure(figsize=(10,10))
sns.heatmap(aus_base_high,
           annot=True,
           )
<AxesSubplot:>
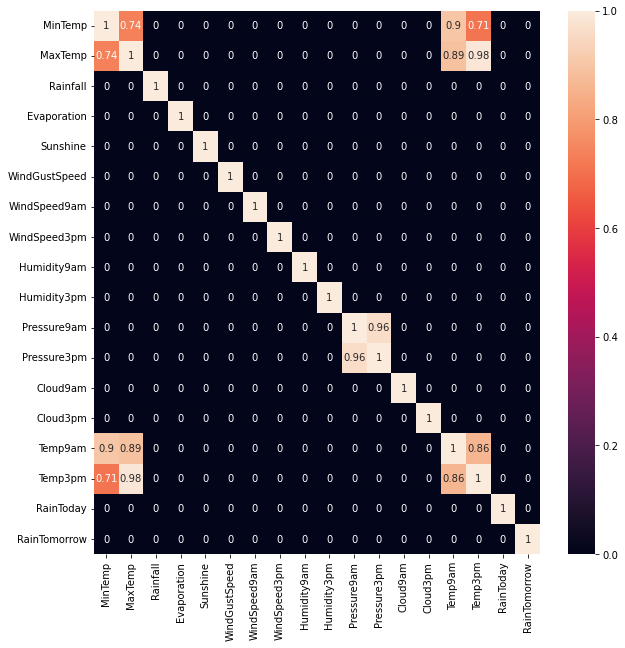
Temperature 그리고 pressure 끼리 상당히 높은 correlation을 보이고 있다.
따라서 mean Temperature / mean pressure 지표를 만들어 통일한다.
결측치 확인
%matplotlib inline
msno.bar(aus_base)
<AxesSubplot:>
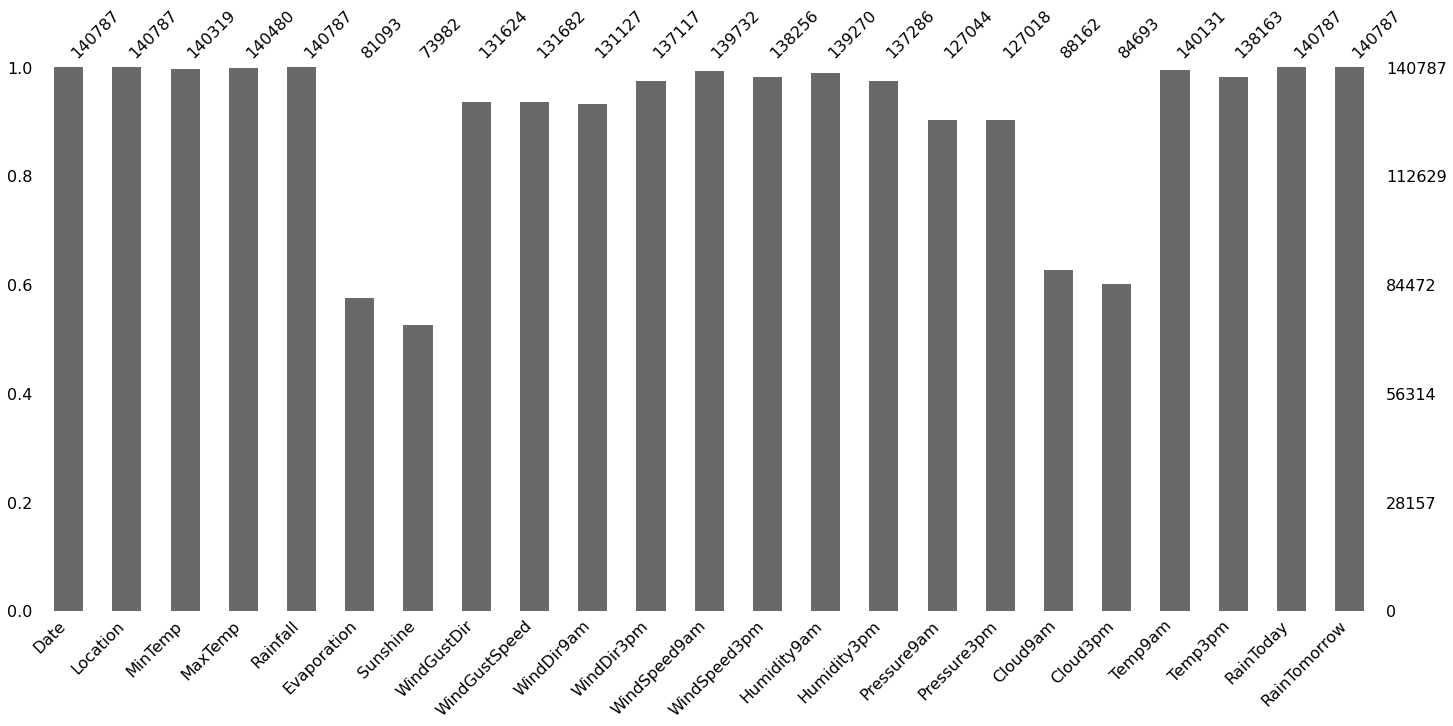
Evaporation, Sunshine, Cloud는 너무 결측치가 많고 유추하기도 힘들기 때문에 관련 파라미터는 모두 제거한다.
데이터 전처리
aus = pd.read_csv('/Users/wooseokpark/Documents/codestates/rain-in-aus/weatherAUS.csv')
print(aus.shape)


#RainToday, RainTomorrow 결측치 행 제거
aus = aus.dropna(subset=['RainToday','RainTomorrow'])

# evaporation, sunshine, cloud는 너무 결측치가 많고 유추하기도 힘들다. 따라서 그냥 제거한다
aus = aus.drop(['Evaporation','Sunshine','Cloud9am','Cloud3pm'], axis=1)

#기타 결측치 제거
aus = aus.dropna()
print('After dropna:',aus.shape)


#RainToday and RainTomorrow values change to 0 and 1
def yesno(x):
    if x == 'Yes':
        return 1
    elif x == 'No':
        return 0
aus['RainToday'] = aus['RainToday'].apply(yesno)
aus['RainTomorrow'] = aus['RainTomorrow'].apply(yesno)

#meanTemp 계산
aus['MeanTemp'] = aus.loc[:,['MinTemp', 'MaxTemp', 'Temp9am', 'Temp3pm']].mean(axis=1)

#meanpressure 계산
aus['MeanPressure'] = aus.loc[:,['Pressure9am', 'Pressure3pm']].mean(axis=1)
(145460, 23)
After dropna: (112925, 19)
WindDir (바람의 방향) : 16가지 방향으로 나뉘어져 있다. 이를 manual 하게 동쪽 : 0 부터 시계방향으로 0~15까지 숫자를 매겼다
aus.loc[:,['WindGustDir', 'WindDir9am', 'WindDir3pm']]
| WindGustDir | WindDir9am | WindDir3pm | |
|---|---|---|---|
| 0 | W | W | WNW |
| 1 | WNW | NNW | WSW |
| 2 | WSW | W | WSW |
| 3 | NE | SE | E |
| 4 | W | ENE | NW |
| ... | ... | ... | ... |
| 145454 | E | ESE | E |
| 145455 | E | SE | ENE |
| 145456 | NNW | SE | N |
| 145457 | N | SE | WNW |
| 145458 | SE | SSE | N |
112925 rows × 3 columns
# WindDir manual encoding

def dir_to_num(valdir):

    ref = {'E':0,
         'ESE':1,
         'SE':2,
         'SSE':3,
         'S':4,
         'SSW':5,
         'SW':6,
         'WSW':7,
         'W':8,
         'WNW':9,
         'NW':10,
         'NNW':11,
         'N':12,
         'NNE':13,
         'NE':14,
         'ENE':15
         }
    return ref[valdir]

aus['WindGustDir'] = aus['WindGustDir'].apply(dir_to_num)
aus['WindDir9am'] = aus['WindDir9am'].apply(dir_to_num)
aus['WindDir3pm'] = aus['WindDir3pm'].apply(dir_to_num)

aus.loc[:,['WindGustDir', 'WindDir9am', 'WindDir3pm']]
| WindGustDir | WindDir9am | WindDir3pm | |
|---|---|---|---|
| 0 | 8 | 8 | 9 |
| 1 | 9 | 11 | 7 |
| 2 | 7 | 8 | 7 |
| 3 | 14 | 2 | 0 |
| 4 | 8 | 15 | 10 |
| ... | ... | ... | ... |
| 145454 | 0 | 1 | 0 |
| 145455 | 0 | 2 | 15 |
| 145456 | 11 | 2 | 12 |
| 145457 | 12 | 2 | 9 |
| 145458 | 2 | 3 | 12 |
112925 rows × 3 columns
# train / test 나누기. 2016년부터 test data로 남겨둠
train = aus[aus['Date'] <= '2016']
test = aus[aus['Date'] > '2016']
train.shape, test.shape

# feature and target selection
features = train.columns.drop(['MinTemp', 'MaxTemp', 'Temp9am', 'Temp3pm',
                               'Pressure9am', 'Pressure3pm',
                               'RainTomorrow'])
target = 'RainTomorrow'


X_train = train[features]
y_train = train[target]

X_test = test[features]
y_test = test[target]
Oversampling
타겟 데이터의 불균형이 4:1 정도이므로, 모델 학습에서 불균형을 줄이기 위해
적은 데이터(내일 비가 오는 데이터)를 oversampling 하여 늘어난 훈련 데이터를 만든다.
# Oversample RainTomorrow = 1 data
oversample = RandomOverSampler(sampling_strategy='minority', random_state=33)

X_over, y_over = oversample.fit_resample(X_train, y_train)

X_train.shape, X_over.shape
((92513, 14), (144352, 14))
Encoding and Scale
OrdinalEncoder : Date, Location
Scale : Rainfall, WindGustSpeed, WindSpeed9am, WindSpeed3pm, Humidity9am, Humidity3pm, MeanTemp, MeanPressure
머신러닝 모델 성능 비교
LogisticRegression / DecisionTree / LightGBM / RandomForestClassifier 로 모델 성능을 비교하였다.
LogisticRegression은 파라미터 조정 없이 Cross-validation 진행.
나머지 모델들은 RandomizedSearchCV 를 이용해 최적의 파라미터를 탐색하였다.
Logistic Regression
pipe_logreg = make_pipeline(
        OrdinalEncoder(cols=['Date','Location']),
        StandardScaler(),
        LogisticRegression()
)


logreg_score = cross_val_score(
                    pipe_logreg,
                    X_over,
                    y_over,
                    cv=5,
                    n_jobs=-1,
                    verbose=0,
                    scoring='f1'
                )

print(logreg_score)
print('Logistic Regression average F1 score:', logreg_score.mean())
[0.69937944 0.74522206 0.76719357 0.78049295 0.74465542]
Logistic Regression average F1 score: 0.7473886885326441
Decision Tree
pipe = make_pipeline(
        OrdinalEncoder(cols=['Date','Location']),
        StandardScaler(),
        DecisionTreeClassifier()
)

params = {
    'decisiontreeclassifier__max_depth': [1,3,5,7],
    'decisiontreeclassifier__min_samples_split': [2,4,6,8],


}

clf = RandomizedSearchCV(
            pipe,
            param_distributions=params,
            n_iter=50,
            cv=5,
            scoring='f1',
            verbose=1,
            n_jobs=-1
)

clf.fit(X_over, y_over)
/Users/wooseokpark/miniforge3/envs/kaggle/lib/python3.8/site-packages/sklearn/model_selection/_search.py:292: UserWarning: The total space of parameters 16 is smaller than n_iter=50. Running 16 iterations. For exhaustive searches, use GridSearchCV.
  warnings.warn(


Fitting 5 folds for each of 16 candidates, totalling 80 fits


RandomizedSearchCV(cv=5,
                   estimator=Pipeline(steps=[('ordinalencoder',
                                              OrdinalEncoder(cols=['Date',
                                                                   'Location'])),
                                             ('standardscaler',
                                              StandardScaler()),
                                             ('decisiontreeclassifier',
                                              DecisionTreeClassifier())]),
                   n_iter=50, n_jobs=-1,
                   param_distributions={'decisiontreeclassifier__max_depth': [1,
                                                                              3,
                                                                              5,
                                                                              7],
                                        'decisiontreeclassifier__min_samples_split': [2,
                                                                                      4,
                                                                                      6,
                                                                                      8]},
                   scoring='f1', verbose=1)
pd.DataFrame(clf.cv_results_).sort_values(by='rank_test_score').T
| 0 | 1 | 2 | 3 | 4 | 5 | 6 | 7 | 8 | 9 | 10 | 11 | 12 | 13 | 14 | 15 | |
|---|---|---|---|---|---|---|---|---|---|---|---|---|---|---|---|---|
| mean_fit_time | 0.22319 | 0.209858 | 0.179838 | 0.166378 | 0.253024 | 0.242938 | 0.256142 | 0.23632 | 0.445896 | 0.494152 | 0.485721 | 0.467065 | 0.535603 | 0.606884 | 0.651005 | 0.524421 |
| std_fit_time | 0.027555 | 0.017316 | 0.032001 | 0.020163 | 0.009928 | 0.010386 | 0.016071 | 0.005868 | 0.070705 | 0.026301 | 0.01693 | 0.042583 | 0.06431 | 0.020495 | 0.025295 | 0.066093 |
| mean_score_time | 0.020056 | 0.019619 | 0.016686 | 0.01563 | 0.015374 | 0.013213 | 0.013777 | 0.013032 | 0.01918 | 0.024833 | 0.020666 | 0.022771 | 0.019853 | 0.022331 | 0.01678 | 0.014882 |
| std_score_time | 0.004059 | 0.007369 | 0.003456 | 0.001711 | 0.002222 | 0.000935 | 0.001083 | 0.001224 | 0.003779 | 0.011583 | 0.006651 | 0.011298 | 0.002675 | 0.005866 | 0.001942 | 0.002268 |
| param_decisiontreeclassifier__min_samples_split | 2 | 4 | 6 | 8 | 2 | 4 | 6 | 8 | 2 | 4 | 6 | 8 | 2 | 4 | 6 | 8 |
| param_decisiontreeclassifier__max_depth | 1 | 1 | 1 | 1 | 3 | 3 | 3 | 3 | 5 | 5 | 5 | 5 | 7 | 7 | 7 | 7 |
| params | {'decisiontreeclassifier__min_samples_split': ... | {'decisiontreeclassifier__min_samples_split': ... | {'decisiontreeclassifier__min_samples_split': ... | {'decisiontreeclassifier__min_samples_split': ... | {'decisiontreeclassifier__min_samples_split': ... | {'decisiontreeclassifier__min_samples_split': ... | {'decisiontreeclassifier__min_samples_split': ... | {'decisiontreeclassifier__min_samples_split': ... | {'decisiontreeclassifier__min_samples_split': ... | {'decisiontreeclassifier__min_samples_split': ... | {'decisiontreeclassifier__min_samples_split': ... | {'decisiontreeclassifier__min_samples_split': ... | {'decisiontreeclassifier__min_samples_split': ... | {'decisiontreeclassifier__min_samples_split': ... | {'decisiontreeclassifier__min_samples_split': ... | {'decisiontreeclassifier__min_samples_split': ... |
| split0_test_score | 0.711589 | 0.711589 | 0.711589 | 0.711589 | 0.599446 | 0.599446 | 0.599446 | 0.599446 | 0.572485 | 0.572485 | 0.572485 | 0.572485 | 0.568051 | 0.568051 | 0.568051 | 0.568051 |
| split1_test_score | 0.677544 | 0.677544 | 0.677544 | 0.677544 | 0.725957 | 0.725957 | 0.725957 | 0.725957 | 0.745404 | 0.745404 | 0.745404 | 0.745404 | 0.644303 | 0.644303 | 0.644303 | 0.644303 |
| split2_test_score | 0.700325 | 0.700325 | 0.700325 | 0.700325 | 0.737965 | 0.737965 | 0.737965 | 0.737965 | 0.753299 | 0.753299 | 0.753299 | 0.753299 | 0.737473 | 0.737473 | 0.737473 | 0.737473 |
| split3_test_score | 0.721713 | 0.721713 | 0.721713 | 0.721713 | 0.759908 | 0.759908 | 0.759908 | 0.759908 | 0.723223 | 0.723223 | 0.723223 | 0.723223 | 0.699072 | 0.699072 | 0.699072 | 0.699072 |
| split4_test_score | 0.724821 | 0.724821 | 0.724821 | 0.724821 | 0.52958 | 0.52958 | 0.52958 | 0.52958 | 0.528457 | 0.528457 | 0.528457 | 0.528457 | 0.553491 | 0.553491 | 0.553491 | 0.553491 |
| mean_test_score | 0.707198 | 0.707198 | 0.707198 | 0.707198 | 0.670571 | 0.670571 | 0.670571 | 0.670571 | 0.664574 | 0.664574 | 0.664574 | 0.664574 | 0.640478 | 0.640478 | 0.640478 | 0.640478 |
| std_test_score | 0.01713 | 0.01713 | 0.01713 | 0.01713 | 0.090031 | 0.090031 | 0.090031 | 0.090031 | 0.094714 | 0.094714 | 0.094714 | 0.094714 | 0.07165 | 0.07165 | 0.07165 | 0.07165 |
| rank_test_score | 1 | 1 | 1 | 1 | 5 | 5 | 5 | 5 | 9 | 9 | 9 | 9 | 13 | 13 | 13 | 13 |
pipe = make_pipeline(
        OrdinalEncoder(cols=['Date','Location']),
        StandardScaler(),
        LGBMClassifier()
)

params = {
    'lgbmclassifier__num_leaves': [10,30,50,70,100],
    'lgbmclassifier__max_depth': [3,5,10,-1],
    'lgbmclassifier__n_estimators': randint(50,500),

}

clf = RandomizedSearchCV(
            pipe,
            param_distributions=params,
            n_iter=50,
            cv=5,
            scoring='f1',
            verbose=1,
            n_jobs=-1
)

clf.fit(X_over, y_over)
Fitting 5 folds for each of 50 candidates, totalling 250 fits


RandomizedSearchCV(cv=5,
                   estimator=Pipeline(steps=[('ordinalencoder',
                                              OrdinalEncoder(cols=['Date',
                                                                   'Location'])),
                                             ('standardscaler',
                                              StandardScaler()),
                                             ('lgbmclassifier',
                                              LGBMClassifier())]),
                   n_iter=50, n_jobs=-1,
                   param_distributions={'lgbmclassifier__max_depth': [3, 5, 10,
                                                                      -1],
                                        'lgbmclassifier__n_estimators': <scipy.stats._distn_infrastructure.rv_frozen object at 0x17cc6c7c0>,
                                        'lgbmclassifier__num_leaves': [10, 30,
                                                                       50, 70,
                                                                       100]},
                   scoring='f1', verbose=1)
pd.DataFrame(clf.cv_results_).sort_values(by='rank_test_score').T
| 37 | 24 | 41 | 2 | 40 | 10 | 33 | 17 | 49 | 5 | ... | 28 | 23 | 16 | 14 | 3 | 7 | 18 | 42 | 29 | 13 | |
|---|---|---|---|---|---|---|---|---|---|---|---|---|---|---|---|---|---|---|---|---|---|
| mean_fit_time | 4.219508 | 3.764854 | 4.306744 | 3.156075 | 2.349996 | 2.541239 | 4.259221 | 1.800981 | 1.66846 | 1.34132 | ... | 2.759526 | 2.395341 | 2.256996 | 2.123278 | 1.988234 | 1.834243 | 1.680075 | 1.553194 | 1.528168 | 1.032888 |
| std_fit_time | 0.025445 | 0.042325 | 0.067512 | 0.085179 | 0.087475 | 0.409916 | 0.706967 | 0.022493 | 0.162522 | 0.020239 | ... | 0.04435 | 0.056451 | 0.057923 | 0.056624 | 0.056956 | 0.04116 | 0.061096 | 0.06149 | 0.210253 | 0.114712 |
| mean_score_time | 1.094693 | 0.974488 | 1.090016 | 0.74212 | 0.541942 | 0.58872 | 0.896226 | 0.403414 | 0.304468 | 0.236299 | ... | 0.32611 | 0.302356 | 0.271547 | 0.226404 | 0.220156 | 0.227446 | 0.209443 | 0.175871 | 0.149758 | 0.132405 |
| std_score_time | 0.076576 | 0.089018 | 0.048744 | 0.044101 | 0.090773 | 0.043904 | 0.067684 | 0.051595 | 0.060979 | 0.070231 | ... | 0.018696 | 0.012853 | 0.011062 | 0.024468 | 0.030404 | 0.008416 | 0.01983 | 0.026374 | 0.009124 | 0.02512 |
| param_lgbmclassifier__max_depth | 10 | 10 | 10 | 10 | 10 | 10 | 10 | 10 | 10 | 10 | ... | 3 | 3 | 3 | 3 | 3 | 3 | 3 | 3 | 3 | 3 |
| param_lgbmclassifier__n_estimators | 422 | 401 | 482 | 376 | 166 | 238 | 478 | 162 | 149 | 84 | ... | 370 | 331 | 337 | 309 | 290 | 279 | 238 | 166 | 160 | 145 |
| param_lgbmclassifier__num_leaves | 70 | 70 | 50 | 50 | 100 | 70 | 30 | 70 | 70 | 100 | ... | 50 | 70 | 10 | 70 | 30 | 50 | 30 | 30 | 10 | 70 |
| params | {'lgbmclassifier__max_depth': 10, 'lgbmclassif... | {'lgbmclassifier__max_depth': 10, 'lgbmclassif... | {'lgbmclassifier__max_depth': 10, 'lgbmclassif... | {'lgbmclassifier__max_depth': 10, 'lgbmclassif... | {'lgbmclassifier__max_depth': 10, 'lgbmclassif... | {'lgbmclassifier__max_depth': 10, 'lgbmclassif... | {'lgbmclassifier__max_depth': 10, 'lgbmclassif... | {'lgbmclassifier__max_depth': 10, 'lgbmclassif... | {'lgbmclassifier__max_depth': 10, 'lgbmclassif... | {'lgbmclassifier__max_depth': 10, 'lgbmclassif... | ... | {'lgbmclassifier__max_depth': 3, 'lgbmclassifi... | {'lgbmclassifier__max_depth': 3, 'lgbmclassifi... | {'lgbmclassifier__max_depth': 3, 'lgbmclassifi... | {'lgbmclassifier__max_depth': 3, 'lgbmclassifi... | {'lgbmclassifier__max_depth': 3, 'lgbmclassifi... | {'lgbmclassifier__max_depth': 3, 'lgbmclassifi... | {'lgbmclassifier__max_depth': 3, 'lgbmclassifi... | {'lgbmclassifier__max_depth': 3, 'lgbmclassifi... | {'lgbmclassifier__max_depth': 3, 'lgbmclassifi... | {'lgbmclassifier__max_depth': 3, 'lgbmclassifi... |
| split0_test_score | 0.630437 | 0.629394 | 0.626181 | 0.619804 | 0.618312 | 0.616617 | 0.613681 | 0.609884 | 0.608624 | 0.604069 | ... | 0.585883 | 0.584696 | 0.585227 | 0.584149 | 0.583905 | 0.583432 | 0.582553 | 0.580554 | 0.580219 | 0.579771 |
| split1_test_score | 0.632802 | 0.631683 | 0.623159 | 0.61674 | 0.617589 | 0.616696 | 0.605544 | 0.606989 | 0.605156 | 0.600612 | ... | 0.574079 | 0.574688 | 0.574118 | 0.573405 | 0.572888 | 0.572411 | 0.571254 | 0.568521 | 0.567693 | 0.566418 |
| split2_test_score | 0.650821 | 0.650056 | 0.645726 | 0.640243 | 0.637135 | 0.635962 | 0.629665 | 0.627273 | 0.626521 | 0.620158 | ... | 0.596098 | 0.595005 | 0.594382 | 0.596393 | 0.595068 | 0.594655 | 0.595327 | 0.596965 | 0.59694 | 0.595247 |
| split3_test_score | 0.670301 | 0.669457 | 0.667275 | 0.660928 | 0.653284 | 0.652239 | 0.641967 | 0.645451 | 0.643125 | 0.64577 | ... | 0.599586 | 0.599917 | 0.600114 | 0.598865 | 0.59828 | 0.598807 | 0.599095 | 0.599812 | 0.599645 | 0.600063 |
| split4_test_score | 0.640071 | 0.638424 | 0.632721 | 0.625411 | 0.622127 | 0.620179 | 0.615748 | 0.609611 | 0.607448 | 0.604228 | ... | 0.579559 | 0.578751 | 0.579036 | 0.578725 | 0.57817 | 0.577957 | 0.576805 | 0.572829 | 0.573238 | 0.573202 |
| mean_test_score | 0.644886 | 0.643803 | 0.639012 | 0.632625 | 0.629689 | 0.628338 | 0.621321 | 0.619841 | 0.618175 | 0.614967 | ... | 0.587041 | 0.586611 | 0.586575 | 0.586307 | 0.585663 | 0.585453 | 0.585007 | 0.583736 | 0.583547 | 0.58294 |
| std_test_score | 0.014554 | 0.014702 | 0.016121 | 0.016296 | 0.013749 | 0.01392 | 0.012917 | 0.014697 | 0.014615 | 0.016828 | ... | 0.009641 | 0.009541 | 0.009572 | 0.00988 | 0.009696 | 0.009934 | 0.010653 | 0.012602 | 0.012706 | 0.012826 |
| rank_test_score | 1 | 2 | 3 | 4 | 5 | 6 | 7 | 8 | 9 | 10 | ... | 41 | 42 | 43 | 44 | 45 | 46 | 47 | 48 | 49 | 50 |
16 rows × 50 columns
pipe = make_pipeline(
        OrdinalEncoder(cols=['Date','Location']),
        StandardScaler(),
        RandomForestClassifier()
)

params = {
    'randomforestclassifier__max_depth': [5, 10, 15, 20, None],
    'randomforestclassifier__n_estimators': [20,50,100,200], #50, 500
    'randomforestclassifier__max_features': uniform(0,1)


}

clf = RandomizedSearchCV(
            pipe,
            param_distributions=params,
            n_iter=20,
            cv=3,
            scoring='f1',
            verbose=1,
            n_jobs=-1
)

clf.fit(X_over, y_over)
Fitting 3 folds for each of 20 candidates, totalling 60 fits


RandomizedSearchCV(cv=3,
                   estimator=Pipeline(steps=[('ordinalencoder',
                                              OrdinalEncoder(cols=['Date',
                                                                   'Location'])),
                                             ('standardscaler',
                                              StandardScaler()),
                                             ('randomforestclassifier',
                                              RandomForestClassifier())]),
                   n_iter=20, n_jobs=-1,
                   param_distributions={'randomforestclassifier__max_depth': [5,
                                                                              10,
                                                                              15,
                                                                              20,
                                                                              None],
                                        'randomforestclassifier__max_features': <scipy.stats._distn_infrastructure.rv_frozen object at 0x17ddd3a90>,
                                        'randomforestclassifier__n_estimators': [20,
                                                                                 50,
                                                                                 100,
                                                                                 200]},
                   scoring='f1', verbose=1)
pd.DataFrame(clf.cv_results_).sort_values(by='rank_test_score').T
| 3 | 9 | 16 | 2 | 19 | 1 | 14 | 17 | 4 | 11 | 12 | 7 | 0 | 6 | 10 | 15 | 8 | 13 | 5 | 18 | |
|---|---|---|---|---|---|---|---|---|---|---|---|---|---|---|---|---|---|---|---|---|
| mean_fit_time | 4.050528 | 20.172477 | 59.841853 | 17.109839 | 16.343223 | 6.83256 | 95.6871 | 2.475331 | 77.207505 | 17.910049 | 47.169729 | 10.570477 | 10.100644 | 8.240047 | 77.194378 | 13.478534 | 24.702126 | 29.732548 | 20.515289 | 5.366548 |
| std_fit_time | 0.063132 | 0.211569 | 2.238457 | 0.364082 | 0.096798 | 0.150363 | 0.967968 | 0.05469 | 1.523949 | 0.352815 | 1.450605 | 0.373929 | 0.55232 | 0.399419 | 2.451861 | 0.395503 | 0.780268 | 1.131228 | 1.145458 | 0.161022 |
| mean_score_time | 0.508217 | 0.327155 | 0.478551 | 0.310827 | 0.759938 | 0.14836 | 0.620624 | 0.170673 | 1.267898 | 0.337097 | 1.304811 | 1.175422 | 0.316759 | 0.177816 | 0.871294 | 0.283727 | 0.496786 | 1.050092 | 0.355683 | 0.130447 |
| std_score_time | 0.063103 | 0.044059 | 0.050219 | 0.056991 | 0.107923 | 0.010833 | 0.059589 | 0.017972 | 0.184956 | 0.049118 | 0.174867 | 0.118506 | 0.024334 | 0.01063 | 0.142835 | 0.02784 | 0.058514 | 0.106238 | 0.066154 | 0.019752 |
| param_randomforestclassifier__max_depth | None | None | 20 | 20 | 20 | 20 | 15 | 15 | 15 | 15 | 15 | 10 | 5 | 5 | 10 | 10 | 10 | 10 | 5 | 10 |
| param_randomforestclassifier__max_features | 0.080046 | 0.60764 | 0.958576 | 0.641576 | 0.220544 | 0.582523 | 0.96526 | 0.170668 | 0.703753 | 0.594817 | 0.363315 | 0.087454 | 0.467111 | 0.762574 | 0.896585 | 0.609305 | 0.544591 | 0.354559 | 0.959535 | 0.576953 |
| param_randomforestclassifier__n_estimators | 50 | 50 | 100 | 50 | 100 | 20 | 200 | 20 | 200 | 50 | 200 | 200 | 100 | 50 | 200 | 50 | 100 | 200 | 100 | 20 |
| params | {'randomforestclassifier__max_depth': None, 'r... | {'randomforestclassifier__max_depth': None, 'r... | {'randomforestclassifier__max_depth': 20, 'ran... | {'randomforestclassifier__max_depth': 20, 'ran... | {'randomforestclassifier__max_depth': 20, 'ran... | {'randomforestclassifier__max_depth': 20, 'ran... | {'randomforestclassifier__max_depth': 15, 'ran... | {'randomforestclassifier__max_depth': 15, 'ran... | {'randomforestclassifier__max_depth': 15, 'ran... | {'randomforestclassifier__max_depth': 15, 'ran... | {'randomforestclassifier__max_depth': 15, 'ran... | {'randomforestclassifier__max_depth': 10, 'ran... | {'randomforestclassifier__max_depth': 5, 'rand... | {'randomforestclassifier__max_depth': 5, 'rand... | {'randomforestclassifier__max_depth': 10, 'ran... | {'randomforestclassifier__max_depth': 10, 'ran... | {'randomforestclassifier__max_depth': 10, 'ran... | {'randomforestclassifier__max_depth': 10, 'ran... | {'randomforestclassifier__max_depth': 5, 'rand... | {'randomforestclassifier__max_depth': 10, 'ran... |
| split0_test_score | 0.666261 | 0.664125 | 0.661308 | 0.662193 | 0.663834 | 0.661172 | 0.64391 | 0.636981 | 0.645065 | 0.644456 | 0.644456 | 0.600122 | 0.57333 | 0.570751 | 0.603448 | 0.601968 | 0.601252 | 0.600739 | 0.569348 | 0.600421 |
| split1_test_score | 0.783653 | 0.692561 | 0.688598 | 0.685062 | 0.678993 | 0.684658 | 0.674265 | 0.696467 | 0.672339 | 0.671863 | 0.665242 | 0.715848 | 0.718688 | 0.704288 | 0.62734 | 0.622831 | 0.621373 | 0.618884 | 0.688599 | 0.619213 |
| split2_test_score | 0.684615 | 0.668362 | 0.665963 | 0.666481 | 0.668776 | 0.665048 | 0.639773 | 0.623604 | 0.638032 | 0.636995 | 0.635437 | 0.579328 | 0.539807 | 0.537055 | 0.577316 | 0.575807 | 0.574401 | 0.575641 | 0.536944 | 0.574558 |
| mean_test_score | 0.711509 | 0.675016 | 0.671956 | 0.671245 | 0.670534 | 0.670293 | 0.65265 | 0.652351 | 0.651812 | 0.651105 | 0.648378 | 0.631766 | 0.610609 | 0.604031 | 0.602701 | 0.600202 | 0.599009 | 0.598421 | 0.598297 | 0.598064 |
| std_test_score | 0.05156 | 0.012526 | 0.01192 | 0.009925 | 0.006312 | 0.01028 | 0.015378 | 0.031669 | 0.014796 | 0.014991 | 0.01248 | 0.060058 | 0.077639 | 0.072214 | 0.020429 | 0.019238 | 0.019242 | 0.01773 | 0.06521 | 0.018306 |
| rank_test_score | 1 | 2 | 3 | 4 | 5 | 6 | 7 | 8 | 9 | 10 | 11 | 12 | 13 | 14 | 15 | 16 | 17 | 18 | 19 | 20 |
Best model : RandomForestClassifier - Test set에 적용하여 성능 평가
best_pipe = clf.best_estimator_
y_pred = best_pipe.predict(X_test)
print(classification_report(y_test, y_pred))
              precision    recall  f1-score   support

           0       0.85      0.96      0.90     15730
           1       0.74      0.43      0.55      4682

    accuracy                           0.84     20412
   macro avg       0.80      0.69      0.72     20412
weighted avg       0.82      0.84      0.82     20412
'''
[Baseline Model classification report]
              precision    recall  f1-score   support

         0.0       0.78      1.00      0.88    109585
         1.0       0.00      0.00      0.00     31201

    accuracy                           0.78    140786
   macro avg       0.39      0.50      0.44    140786
weighted avg       0.61      0.78      0.68    140786
'''
'\n[Baseline Model classification report]\n precision recall f1-score support\n\n 0.0 0.78 1.00 0.88 109585\n 1.0 0.00 0.00 0.00 31201\n\n accuracy 0.78 140786\n macro avg 0.39 0.50 0.44 140786\nweighted avg 0.61 0.78 0.68 140786\n'
최종 모델 test 결과
baseline model 에 비해 test set 에서 accuracy 0.78 -> 0.84 로 상승.
average f1-score 은 0.44 -> 0.72 로 상승.
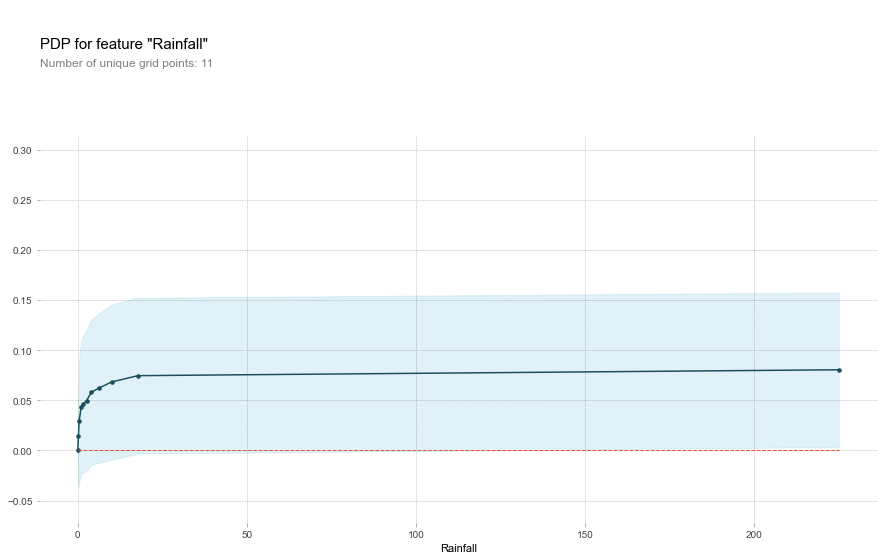
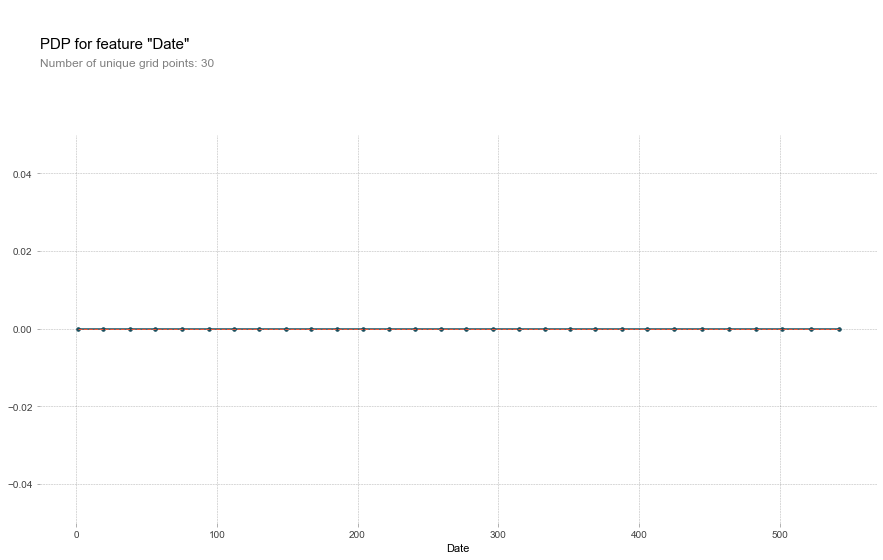
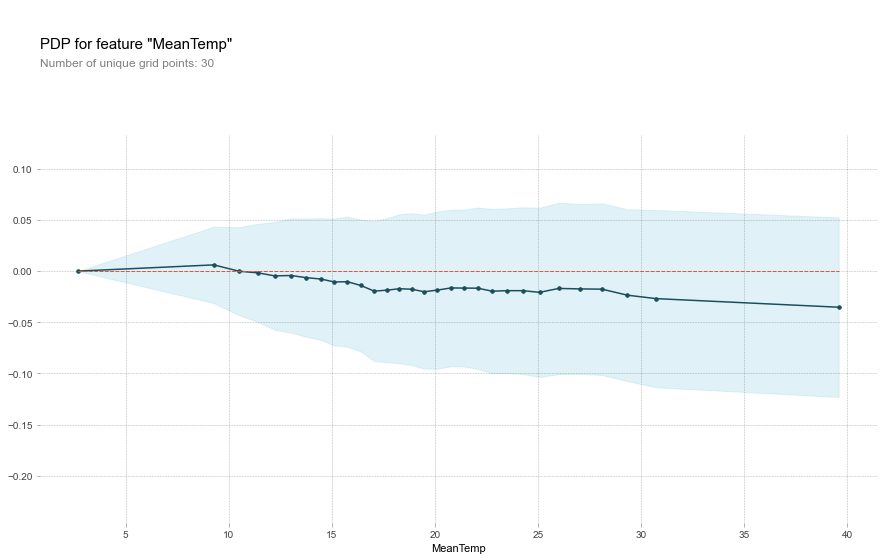
머신러닝 모델 해석 - PDP Plot으로 특성들의 모델에 대한 기여도 확인
y_pred = best_pipe.predict(X_test)
print(classification_report(y_test, y_pred))
              precision    recall  f1-score   support

           0       0.86      0.95      0.90     15730
           1       0.74      0.47      0.58      4682

    accuracy                           0.84     20412
   macro avg       0.80      0.71      0.74     20412
weighted avg       0.83      0.84      0.83     20412
X_test.columns
Index(['Date', 'Location', 'Rainfall', 'WindGustDir', 'WindGustSpeed',
       'WindDir9am', 'WindDir3pm', 'WindSpeed9am', 'WindSpeed3pm',
       'Humidity9am', 'Humidity3pm', 'RainToday', 'MeanTemp', 'MeanPressure'],
      dtype='object')
X_test.Rainfall.max()
225.0
from pdpbox.pdp import pdp_isolate, pdp_plot

X_test_encoded = OrdinalEncoder(cols=['Date','Location']).fit_transform(X_test)

def pdpplot(feature):

    isolated = pdp_isolate(
        model=best_pipe,
        dataset=X_test_encoded,
        model_features=X_test_encoded.columns,
        feature=feature,
        grid_type='percentile', # default='percentile', or 'equal'
        num_grid_points=30 # default=10
    )
    pdp_plot(isolated, feature_name=feature)

pdpplot('Rainfall')
pdpplot('Date')
pdpplot('MeanTemp')
Conclusion
- 호주 기상 데이터를 바탕으로 다음날 비가 내렸는지를 예측해 보았다.
- EDA 로 결측치 및 feature correlation 확인하였고, 특성공학을 수행하였다.
- Imbalanced 되어 있는 Target 에 대해 oversampling하여 훈련셋을 만들었다.
- LogisticRegression, DecisionTree, LightGBM, RandomForestClassifier 로 각각 CV를 적용한 모델 훈련 결과를 비교하였다.
- 가장 결과가 잘 나온 RandomForest 로 test 데이터에 적용해 보았고, baseline model 보다 상당한 성능 향상을 보였다.
- PDP Plot으로 몇 가지 feature들이 타겟 예측에 어떻게 기여했는지 살펴보았다.
- 모델이 어느 정도 날씨 예측 향상에 기여했다는 것을 확인했다.
아쉬운 점
- feature importance를 살펴보지 못했다.
- 여전히 비가 오는 경우 예측의 recall 점수가 너무 낮았다.
- 좀더 다양한 모델과 hyperparameter 튜닝을 해보지 못해 아쉬웠다.